Research
Fire severity mapping as basal area loss
I am currently working on a project mapping fire severity as percent basal area loss in the western US. I am excited for the Google Earth Engine severity mapping tool to be available once the paper is out - the link will be posted here as well as to my github repo. The tool will allow anyone to map fire severity for any fire since 1985 in the western US, and to output % basal area loss as well as any of the calculated variables (eg. RdNBR, post-fire NBR, elevation, mean precipitation, etc).
The analysis uses field data and a suite of spectral, climatic, and topographic variables extracted from Earth Engine and uses a conditional predictive impact (CPI) analysis for data reduction and hyperparameter tuning using random forest analysis in R. The resulting model is then put back into Earth Engine for the prediction script which is easily modifiable for users. Many thanks to all of the data contributors who shared their plot data with me.
Stay tuned!
Subalpine forest biomass
I developed the highest accuracty aboveground biomass map for subalpine forests in the Sierra Nevada using lidar and field measurements. I gathered plot data from Forest Inventory and Analysis (FIA), National Park Service Inventory and Monitoring foxtail and whitebark pine program, the US Forest Service Region 5 whitebark pine monitoring, and my own field work in post-fire subalpine forests, which spanned fire severities in the south and central Sierra Nevada. Tree height and diameter data is converted to biomass through allometric equations, and then related to lidar metrics (canopy cover, canopy rumple, and mean height).
We estimated biomass using a Bayesian geostatistical model, which
incorporates spatial autocorrelation (similar to Kriging) and gives
robust measurements for estimates and error at both pixel level and for
four management units. We used a 5-fold cross-validation, which allowed
us to compare our results with those of two other biomass maps, LEMMA
and eMapR, both from Oregon State researchers. Our model had much higher
accuracy and precision, and lower bias. An interactive map of biomass is
available at this
Earth Engine app!
This research was funded by a CAL FIRE
Forest Health Research Grant (beginning June 2019) and minigrants from
the Sequoia Parks Conservancy’s Sequoia Science and Learning Center
(funded in 2018 and 2019).
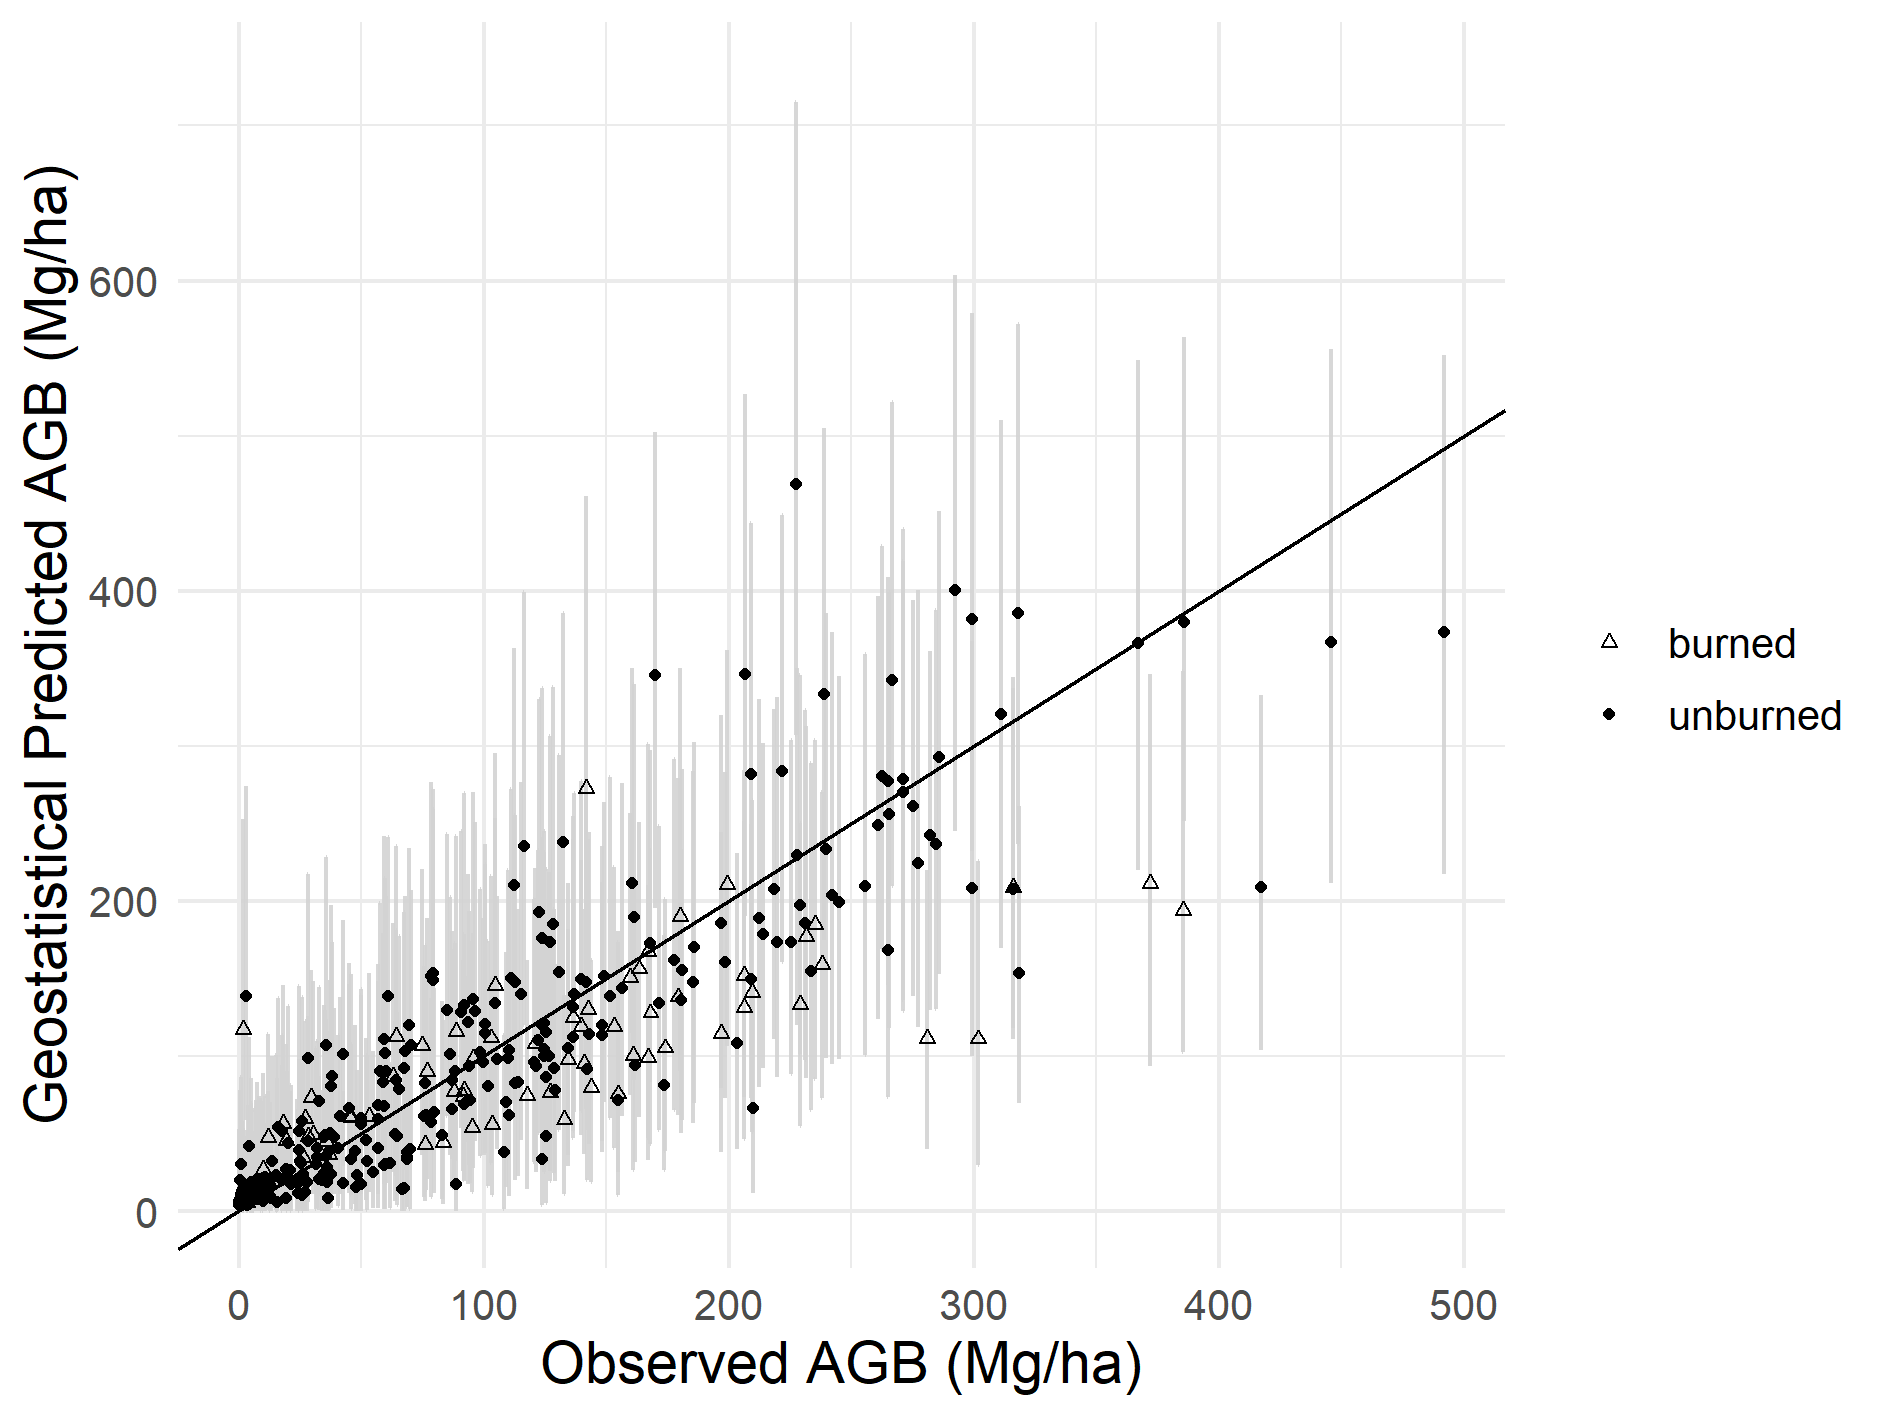
Observed vs predicted aboveground biomass.
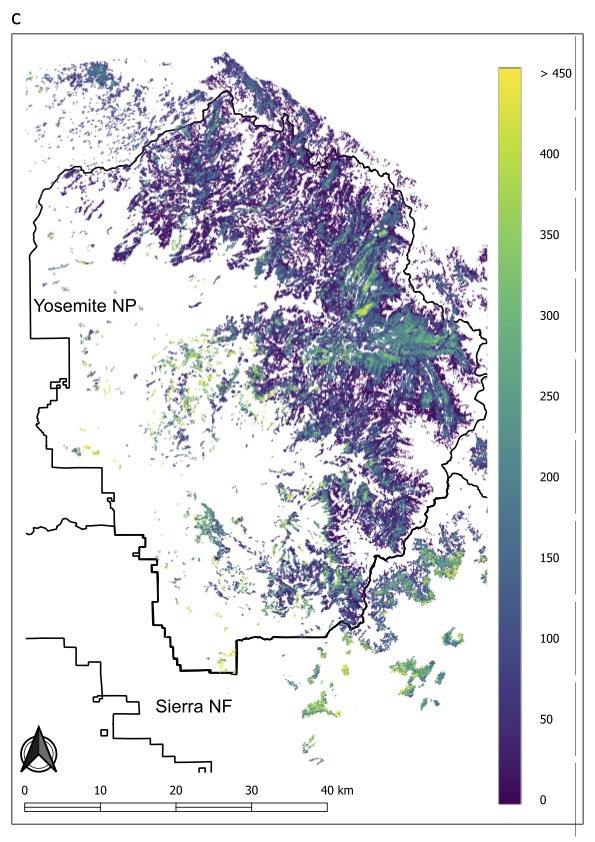
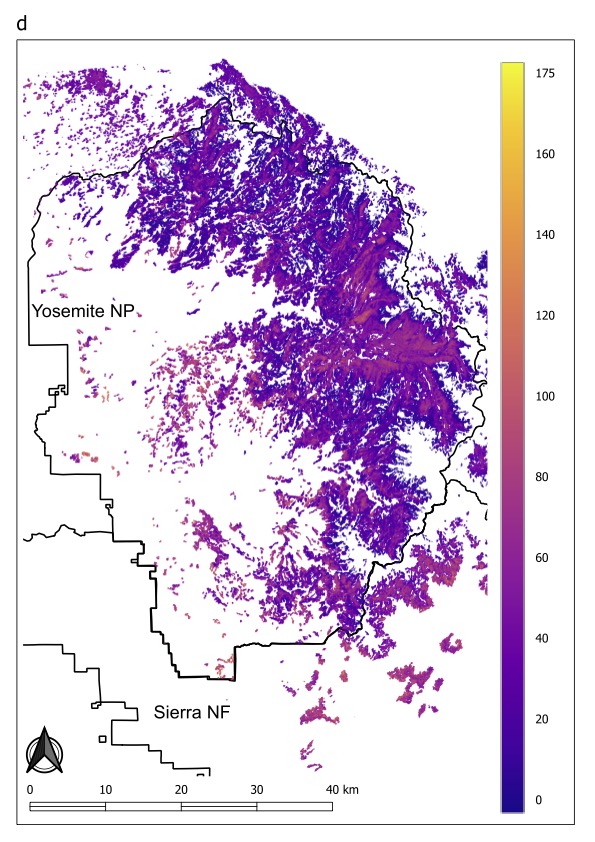
Estimate and standard
deviation of aboveground biomass in the Yosemite region.
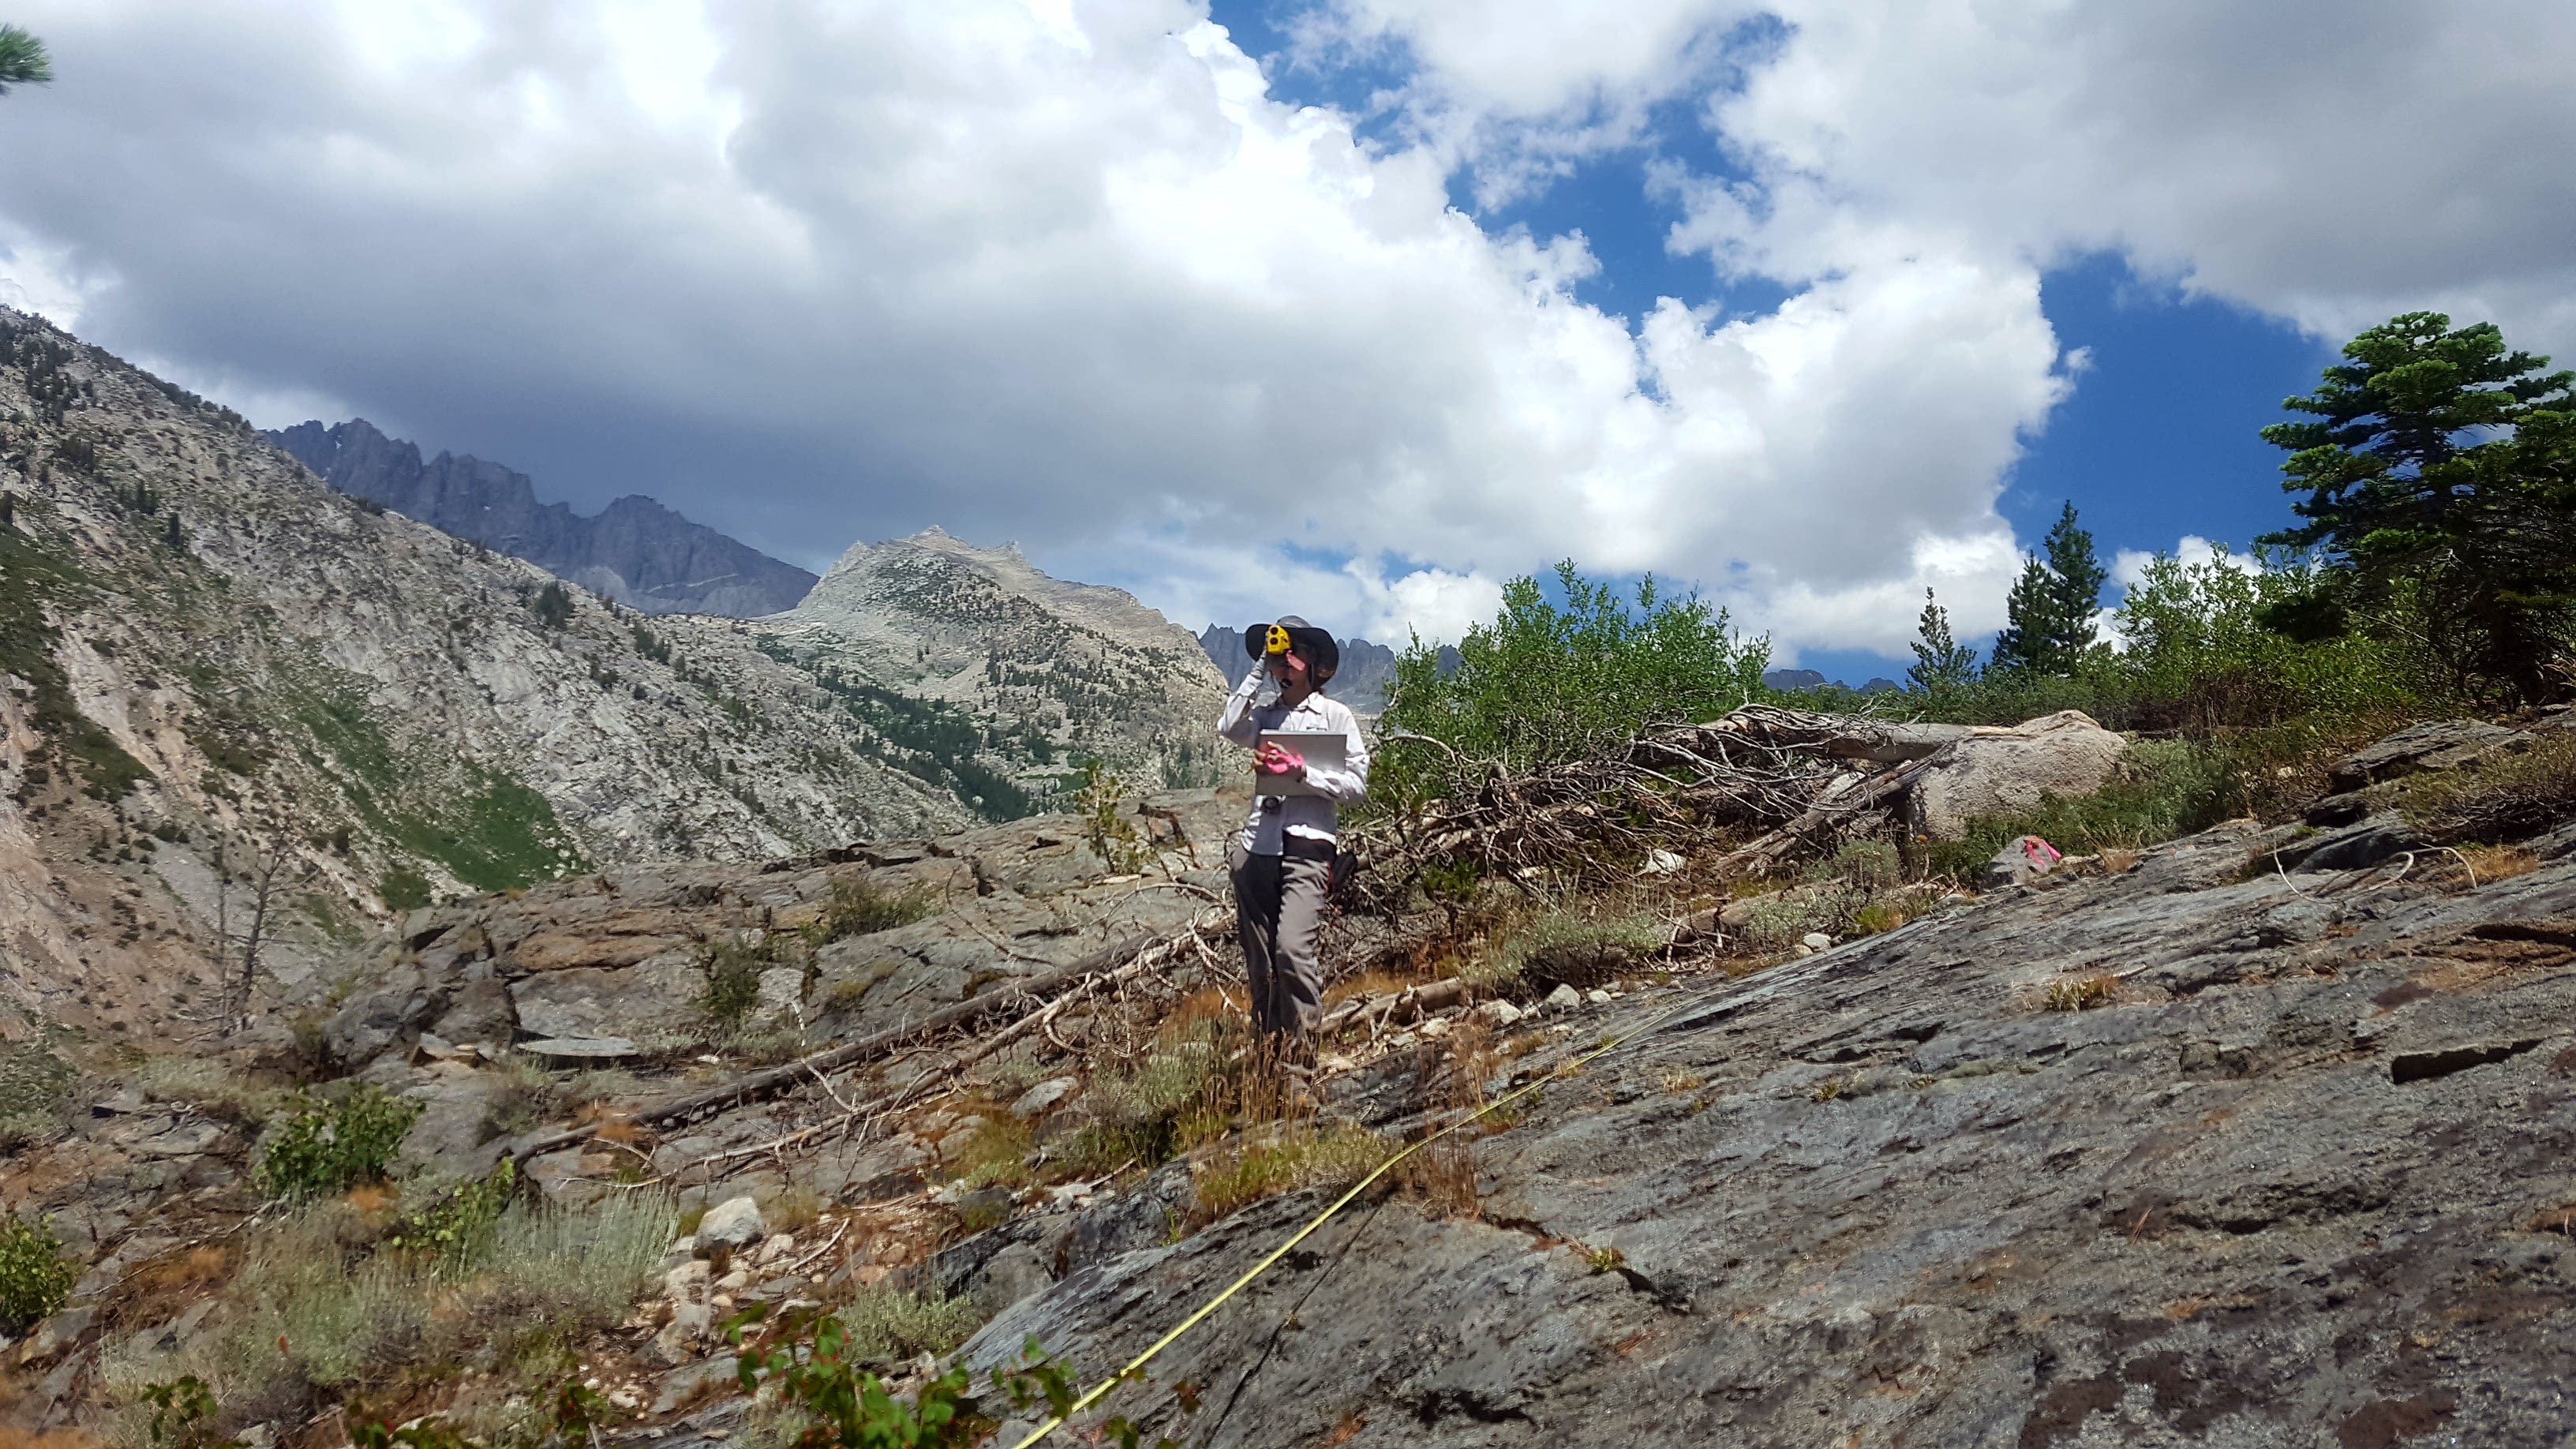
Measuring tree
heights in Kings Canyon National Park during summer 2018 field work.
Drivers of subalpine forest biomass
From this research I am also assessing the drivers of biomass. Preliminary analysis shows that, as expected, energy-related drivers are the most important, including elevation and mean temperature. We also see local importance of water-related drivers, particularly on the drier east side of the Sierra Nevada, and soil characteristics such as soil depth and water holding capacity.
Again, stay tuned for more!